Getting Started
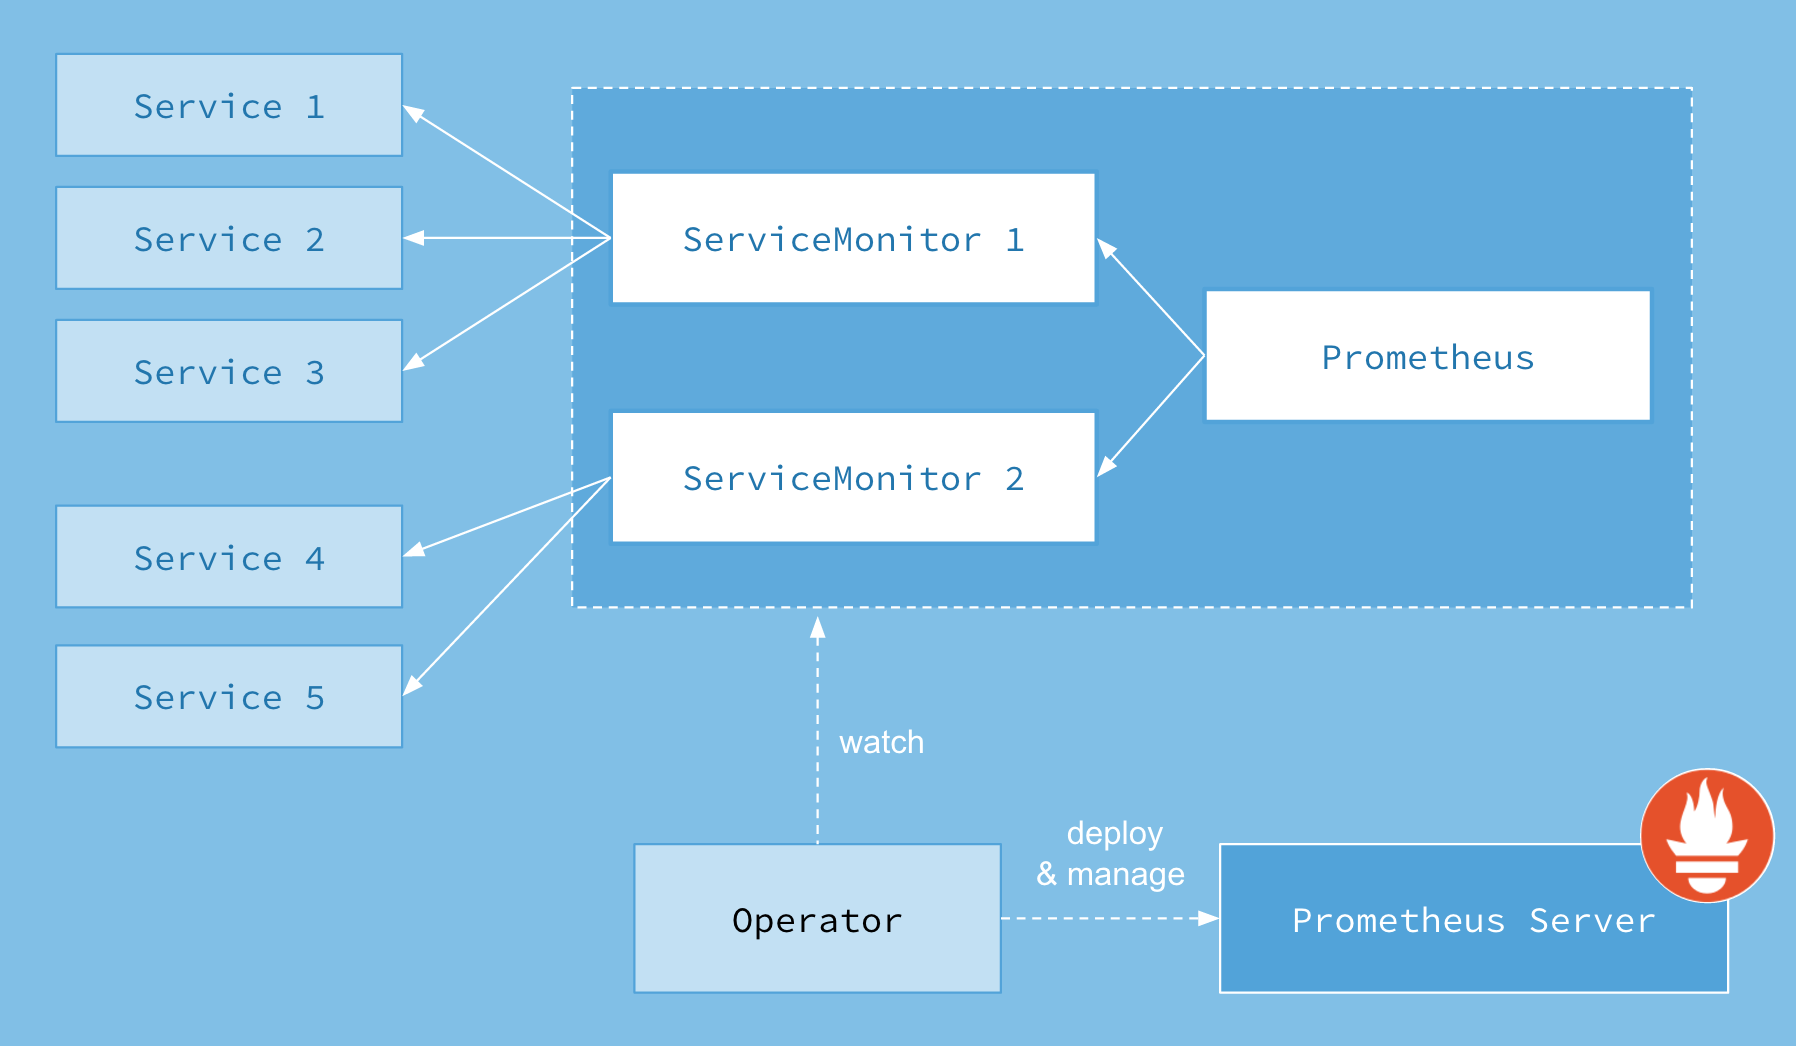
The Prometheus Operator’s goal is to make running Prometheus on top of Kubernetes as easy as possible, while preserving Kubernetes-native configuration options.
This guide will show you how to deploy the Prometheus operator, set up a Prometheus instance, and configure metrics collection for a sample application.
Note: Operators were introduced by CoreOS as a class of software that operates other software, putting operational knowledge collected by humans into software.
Pre-requisites
To follow this guide, you will need a Kubernetes cluster with admin permissions.
Installing the operator
The first step is to install the operator’s Custom Resource Definitions (CRDs) as well as the operator itself with the required RBAC resources.
Run the following commands to install the CRDs and deploy the operator in the default namespace:
LATEST=$(curl -s https://api.github.com/repos/prometheus-operator/prometheus-operator/releases/latest | jq -cr .tag_name)
curl -sL https://github.com/prometheus-operator/prometheus-operator/releases/download/${LATEST}/bundle.yaml | kubectl create -f -
It can take a few minutes for the operator to be up and running. You can check for completion with the following command:
kubectl wait --for=condition=Ready pods -l app.kubernetes.io/name=prometheus-operator -n default
The Prometheus Operator introduces custom resources in Kubernetes to declare the desired state of a Prometheus and Alertmanager cluster as well as the Prometheus configuration. For this guide, the resources of interest are:
PrometheusServiceMonitorPodMonitor
The Prometheus resource declaratively describes the desired state of a
Prometheus deployment, while ServiceMonitor and PodMonitor resources
describe the targets to be monitored by Prometheus.
Note: Check the Alerting guide for more information about the
Alertmanagerresource.
Note: Check the Design page for an overview of all resources introduced by the Prometheus Operator.
Deploying a sample application
First, let’s deploy a simple example application with 3 replicas which listens
and exposes metrics on port 8080.
apiVersion: apps/v1
kind: Deployment
metadata:
  name: example-app
spec:
  replicas: 3
  selector:
    matchLabels:
      app: example-app
  template:
    metadata:
      labels:
        app: example-app
    spec:
      containers:
      - name: example-app
        image: quay.io/brancz/prometheus-example-app:v0.5.0
        ports:
        - name: web
          containerPort: 8080
Let’s expose the application with a Service object which selects all the Pods
with the app label having the example-app value. The Service object also
specifies the port on which the metrics are exposed.
kind: Service
apiVersion: v1
metadata:
  name: example-app
  labels:
    app: example-app
spec:
  selector:
    app: example-app
  ports:
  - name: web
    port: 8080
Finally we create a ServiceMonitor object which selects all Service objects
with the app: example-app label. The ServiceMonitor object also has a team
label (in this case team: frontend) to identify which team is responsible for
monitoring the application/service.
apiVersion: monitoring.coreos.com/v1
kind: ServiceMonitor
metadata:
  name: example-app
  labels:
    team: frontend
spec:
  selector:
    matchLabels:
      app: example-app
  endpoints:
  - port: web
Deploying Prometheus
If RBAC authorization is activated on your cluster, you must first create the RBAC rules for the Prometheus service account beforehand.
Apply the following manifests to create the service account and required ClusterRole/ClusterRoleBinding:
apiVersion: v1
kind: ServiceAccount
metadata:
  name: prometheus
apiVersion: rbac.authorization.k8s.io/v1
kind: ClusterRole
metadata:
  name: prometheus
rules:
- apiGroups: [""]
  resources:
  - nodes
  - nodes/metrics
  - services
  - endpoints
  - pods
  verbs: ["get", "list", "watch"]
- apiGroups: [""]
  resources:
  - configmaps
  verbs: ["get"]
- apiGroups:
  - networking.k8s.io
  resources:
  - ingresses
  verbs: ["get", "list", "watch"]
- nonResourceURLs: ["/metrics"]
  verbs: ["get"]
apiVersion: rbac.authorization.k8s.io/v1
kind: ClusterRoleBinding
metadata:
  name: prometheus
roleRef:
  apiGroup: rbac.authorization.k8s.io
  kind: ClusterRole
  name: prometheus
subjects:
- kind: ServiceAccount
  name: prometheus
  namespace: default
For more information, see the Prometheus Operator RBAC guide.
The Prometheus custom resource defines the characteristics of the underlying
concrete StatefulSet (number of replicas, resource requests/limits , …) as
well as which ServiceMonitors should be included with the
spec.serviceMonitorSelector field.
Previously, we have created the ServiceMonitor object with the team: frontend
label and here we define that the Prometheus object should select all
ServiceMonitors with the team: frontend label. This enables the frontend team
to create new ServiceMonitors and Services without having to reconfigure the
Prometheus object.
apiVersion: monitoring.coreos.com/v1
kind: Prometheus
metadata:
  name: prometheus
spec:
  serviceAccountName: prometheus
  serviceMonitorSelector:
    matchLabels:
      team: frontend
  resources:
    requests:
      memory: 400Mi
  enableAdminAPI: false
To verify that the instance is up and running, run:
kubectl get -n default prometheus prometheus -w
By default, Prometheus will only pick up ServiceMonitors from the current
namespace. To select ServiceMonitors from other namespaces, you can update the
spec.serviceMonitorNamespaceSelector field of the Prometheus resource.
Using PodMonitors
Instead of a ServiceMonitor, we can use a PodMonitor which doesn’t require the
creation of a Kubernetes Service. In practice, the spec.selector label tells
Prometheus which Pods should be scraped.
apiVersion: monitoring.coreos.com/v1
kind: PodMonitor
metadata:
  name: example-app
  labels:
    team: frontend
spec:
  selector:
    matchLabels:
      app: example-app
  podMetricsEndpoints:
  - port: web
Similarly the Prometheus object defines which PodMonitors get selected with the
spec.podMonitorSelector field.
apiVersion: monitoring.coreos.com/v1
kind: Prometheus
metadata:
  name: prometheus
spec:
  serviceAccountName: prometheus
  podMonitorSelector:
    matchLabels:
      team: frontend
  resources:
    requests:
      memory: 400Mi
  enableAdminAPI: false
Exposing the Prometheus service
To access the Prometheus interface, you have to expose the service to the outside. For
simplicity, we use a NodePort Service.
apiVersion: v1
kind: Service
metadata:
  name: prometheus
spec:
  type: NodePort
  ports:
  - name: web
    nodePort: 30900
    port: 9090
    protocol: TCP
    targetPort: web
  selector:
    prometheus: prometheus
Once the Service is created, the Prometheus web server is available under the
node’s IP address on port 30900. The Targets page in the web interface should
show that the instances of the example application have successfully been
discovered.
Note: Exposing the Prometheus web server this way may not be an applicable solution. Read more about the possible options in the Ingress guide.
Exposing the Prometheus Admin API
Prometheus Admin API allows access to delete series for a certain time range, cleanup tombstones, capture snapshots, etc. More information about the admin API can be found in Prometheus official documentation This API access is disabled by default and can be toggled using this boolean flag. The following example exposes the admin API:
WARNING: Enabling the admin APIs enables mutating endpoints, to delete data, shutdown Prometheus, and more. Enabling this should be done with care and the user is advised to add additional authentication/authorization via a proxy to ensure only clients authorized to perform these actions can do so.
apiVersion: monitoring.coreos.com/v1
kind: Prometheus
metadata:
  name: prometheus
spec:
  serviceAccountName: prometheus
  serviceMonitorSelector:
    matchLabels:
      team: frontend
  resources:
    requests:
      memory: 400Mi
  enableAdminAPI: true
Next:
- Alerting describes using the Prometheus Operator to manage Alertmanager clusters.